15–30 min
from the mechanic’s invoice to payment
The mechanic used to wait at the repair shop for up to 5 hours
Bustlers / Case studies
We started with fuel. Now we calculate how much each truck earns
In short
It all started with fuel. Then came repair invoices, expenses, and the economics of every truck. Now TransLine can see how much is left from its trips, and together we’re getting a system ready for other carriers.
The company already had paid services, Bitrix24, and 1C. But fuel had to be pulled together separately, invoices were hunted down in email and chats, and the finance specialist collected expenses in Excel. We started with one specific problem: matching fill-ups to trucks.
Now the finance specialist is a co-author of the system: she tests it, checks the calculations, and comes up with features together with us. The owner, the manager, and the mechanic each brought their own requests. The new website also takes its data from the system — from freight rates to the temperature in the cargo area.
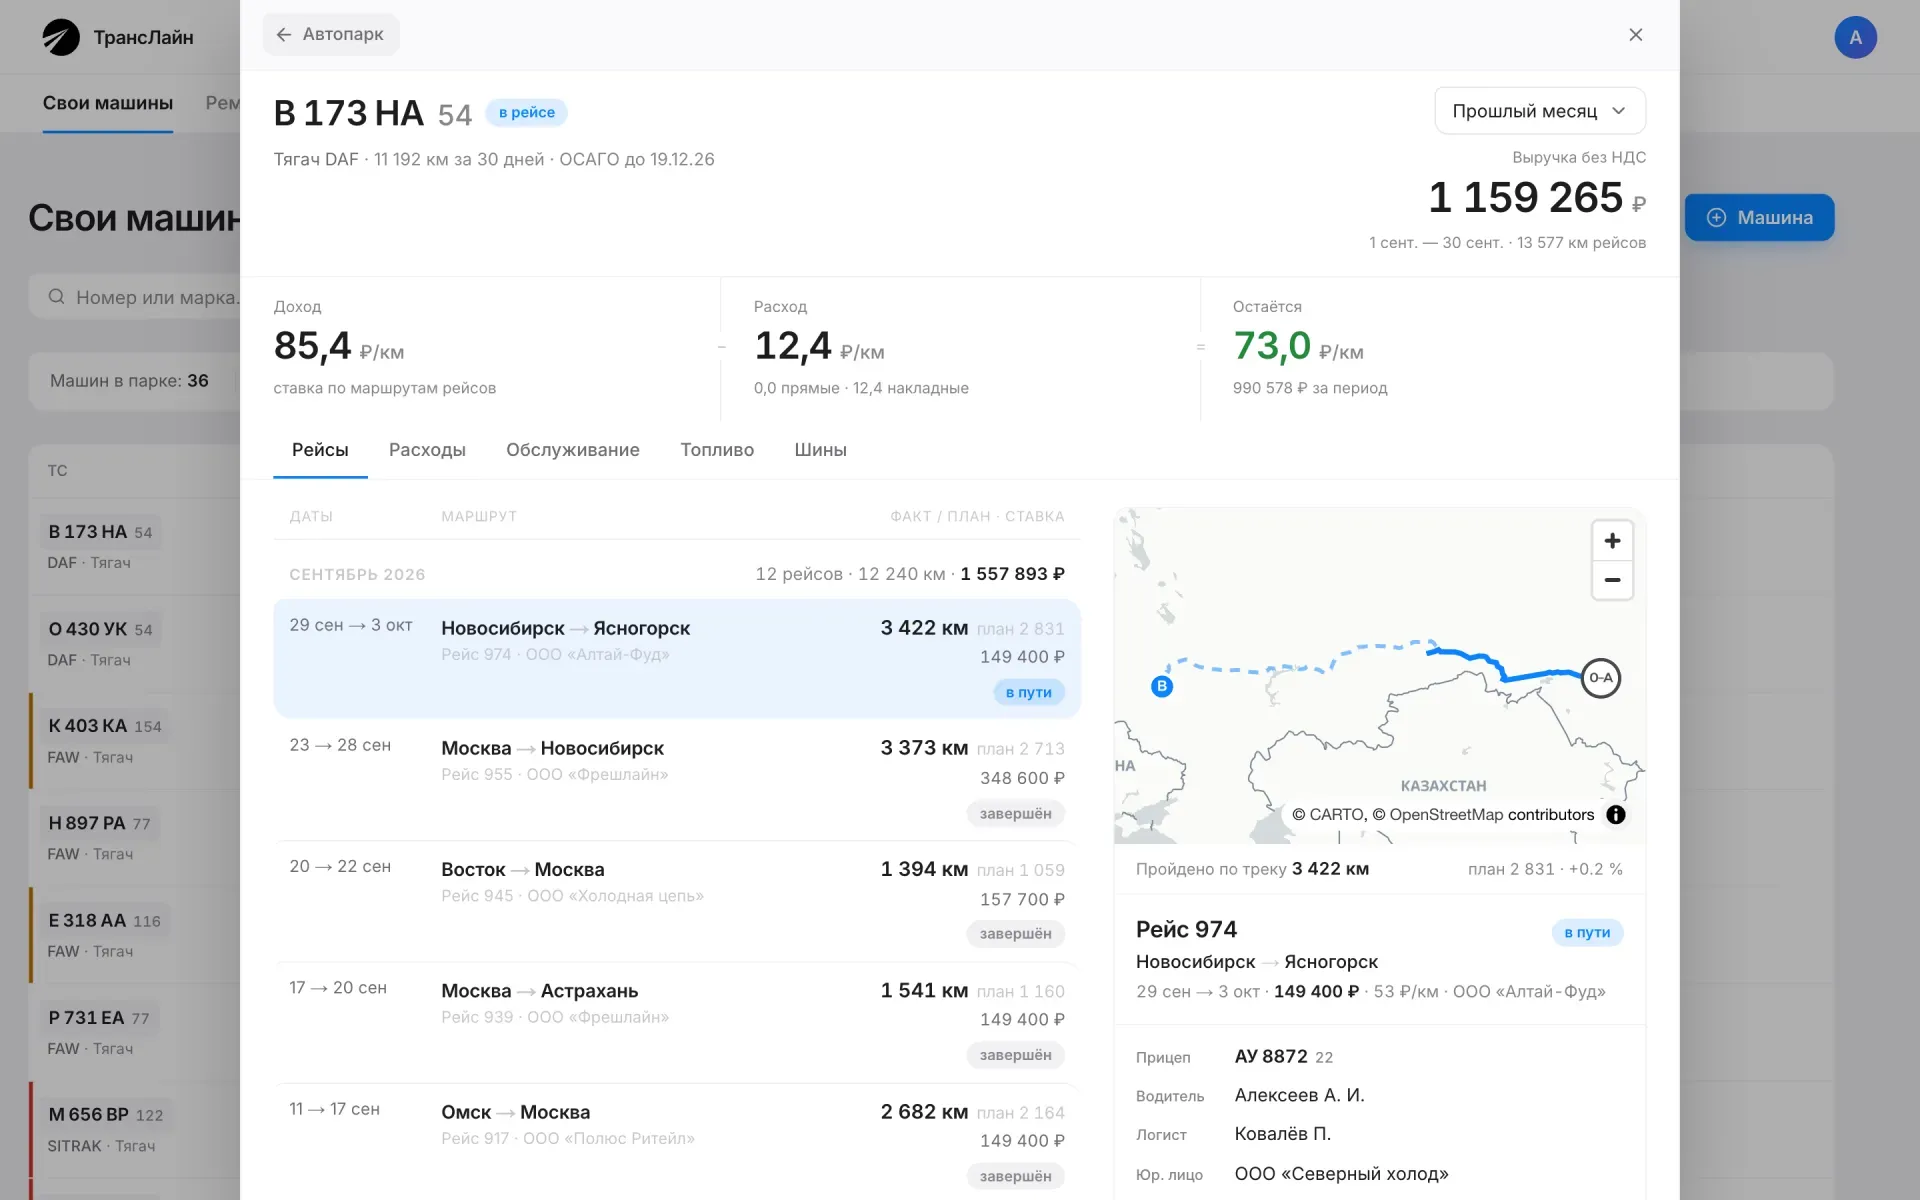
Real screens from the system and the website. Names, truck numbers, companies, and amounts have been changed.
Invoices get paid faster, revenue is counted more accurately, and clients going quiet are spotted earlier.
15–30 min
The mechanic used to wait at the repair shop for up to 5 hours
17.3%
Amounts with and without VAT were added together. Now there is one basis
70 of 414
As of September 17, clients over the past 12 months
$850 a month
The trucks are now tracked by the company’s own system
Where the data comes from
A check at the door. A file whose total doesn’t add up won’t load until a person has looked at it
Who uses it
Everything used to live separately. An invoice could arrive by email, in a chat, or in Bitrix24. The finance specialist copied amounts into Excel, and the fuel chains’ reports were combined on their own. To work out what a truck earned, you first had to collect its expenses from several places.
Now every dollar has a truck. Invoices follow a single route, files are checked before upload, and expenses are tied to trucks. From any calculation you can get back to the original invoice. If data for a month is missing, the system shows the gap.
Together since 2012. We started the system in 2026, and each new task grew out of the one before.
Combined fuel card reports into one summary by truck.
Learned to read invoices and track maintenance. Started the new website.
Tires and overhead costs first, then the result for every truck and kilometer.
Parts analytics, invoices through Max, and the system’s own GPS track of vehicles.
Prices from the company’s own trips reached the website, and a screen for clients going quiet appeared.
The new website moved to the main domain. We’re getting the system ready for other carriers.
01Website
A shipper needs a price for a trip by this evening. They enter the route on the website and immediately see a rate range calculated from the shipments the company has already done.
A site on 1C-Bitrix with libraries from 2013; on a phone you couldn’t zoom the page. The calculator pulled its price from a page on someone else’s website.
A new site with a dark design and separate pages for marketplaces, retail chains, and manufacturers. The calculator works from the company’s own trips, and when there isn’t enough data, it offers to price by the hour.

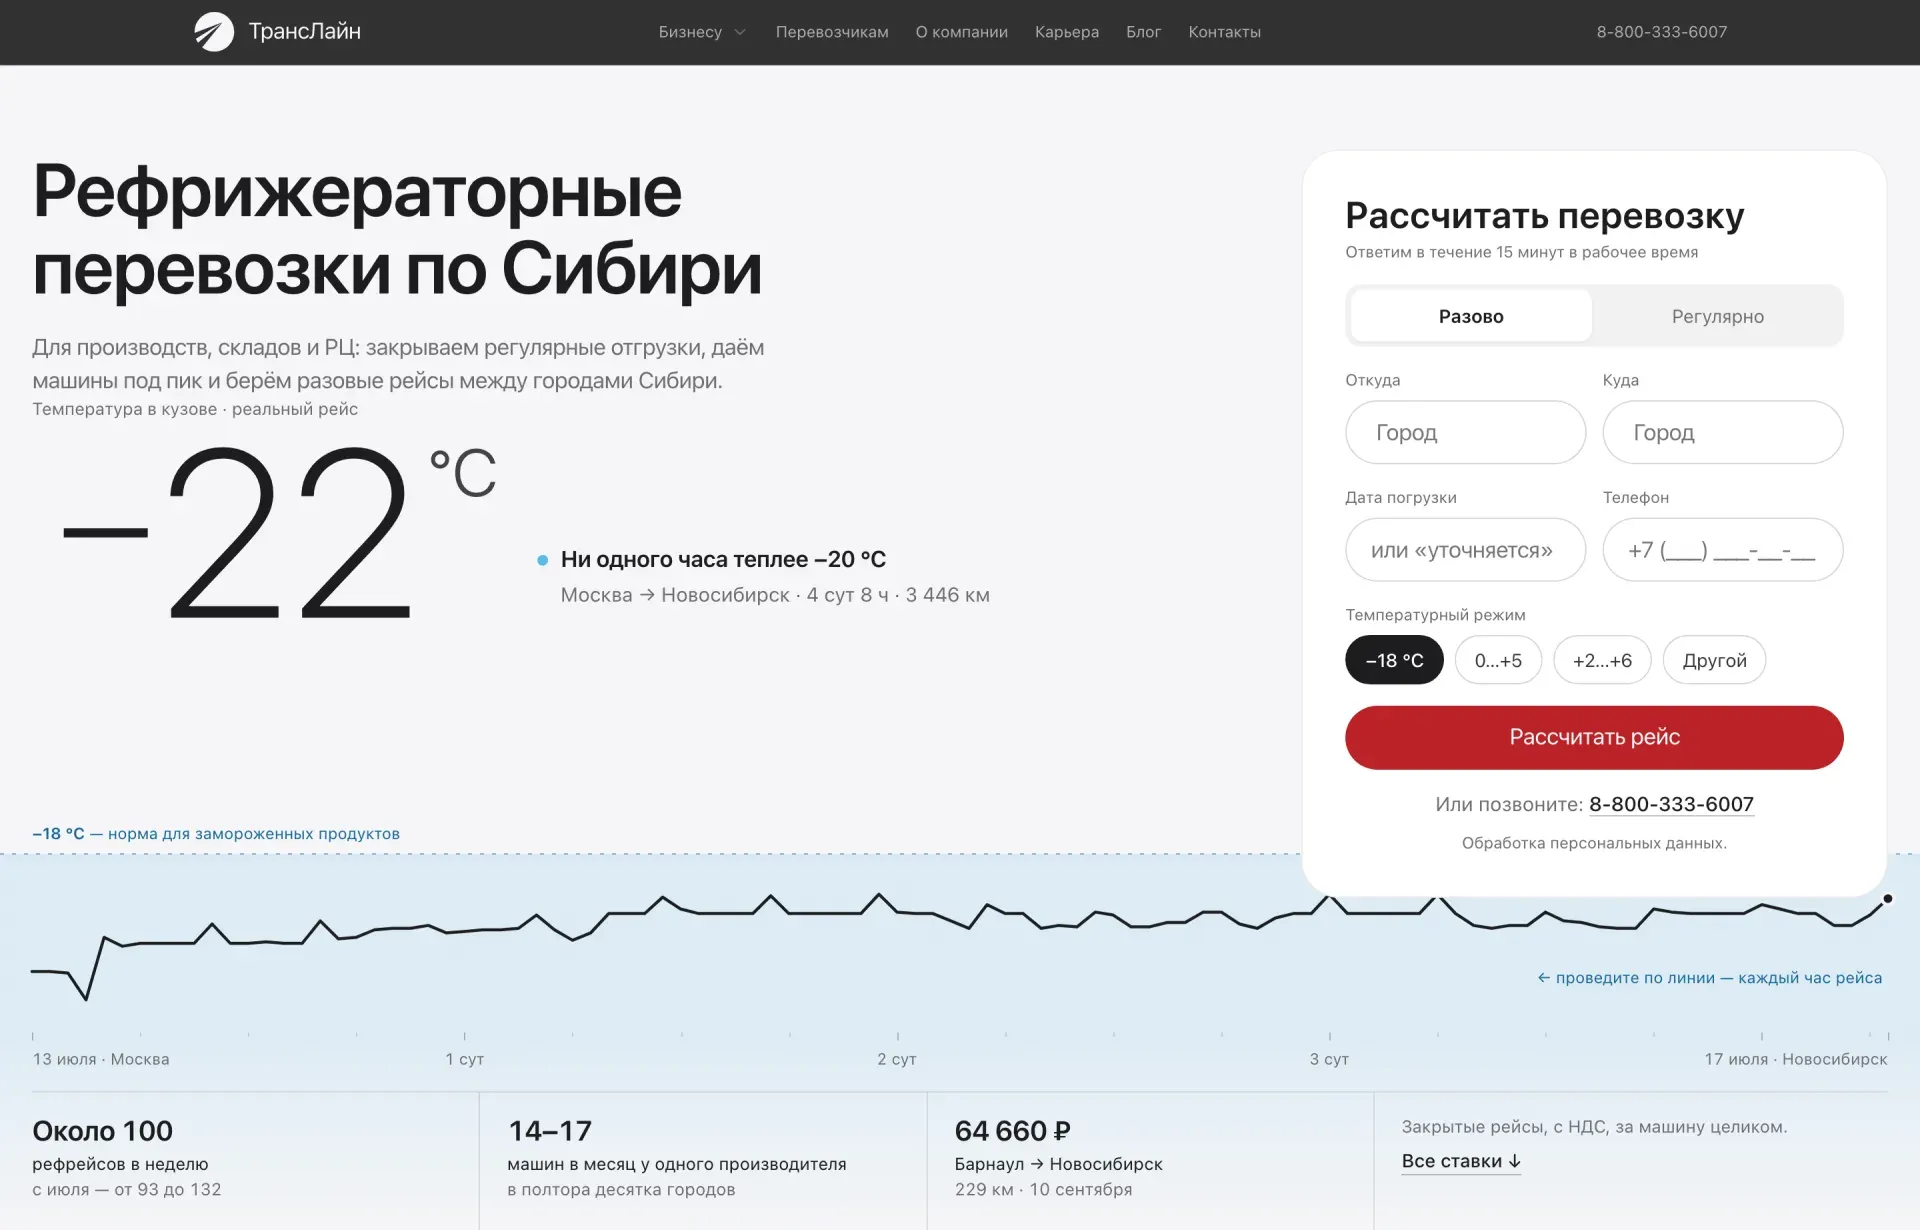



74–76% of estimates land within ±20% of the actual rate. We won’t release a model to the website if it scores below 70%.
74–76%
The refrigerated freight page shows a Moscow → Novosibirsk trip from the system: not a single hour warmer than −20 °C, 36,777 readings. The shipper sees how the company keeps the cold.
02Fuel
End of the month. The accountant has five reports from five fuel chains, each in its own format. The question is simple — how much did each truck fill up — but the answer gets assembled by hand.
There was no fuel tracking either in the paid order platform or in the monitoring service. The chains’ reports were combined by hand.
Files are uploaded as they are: the system recognizes the chain, checks the total, and builds the summary by truck.
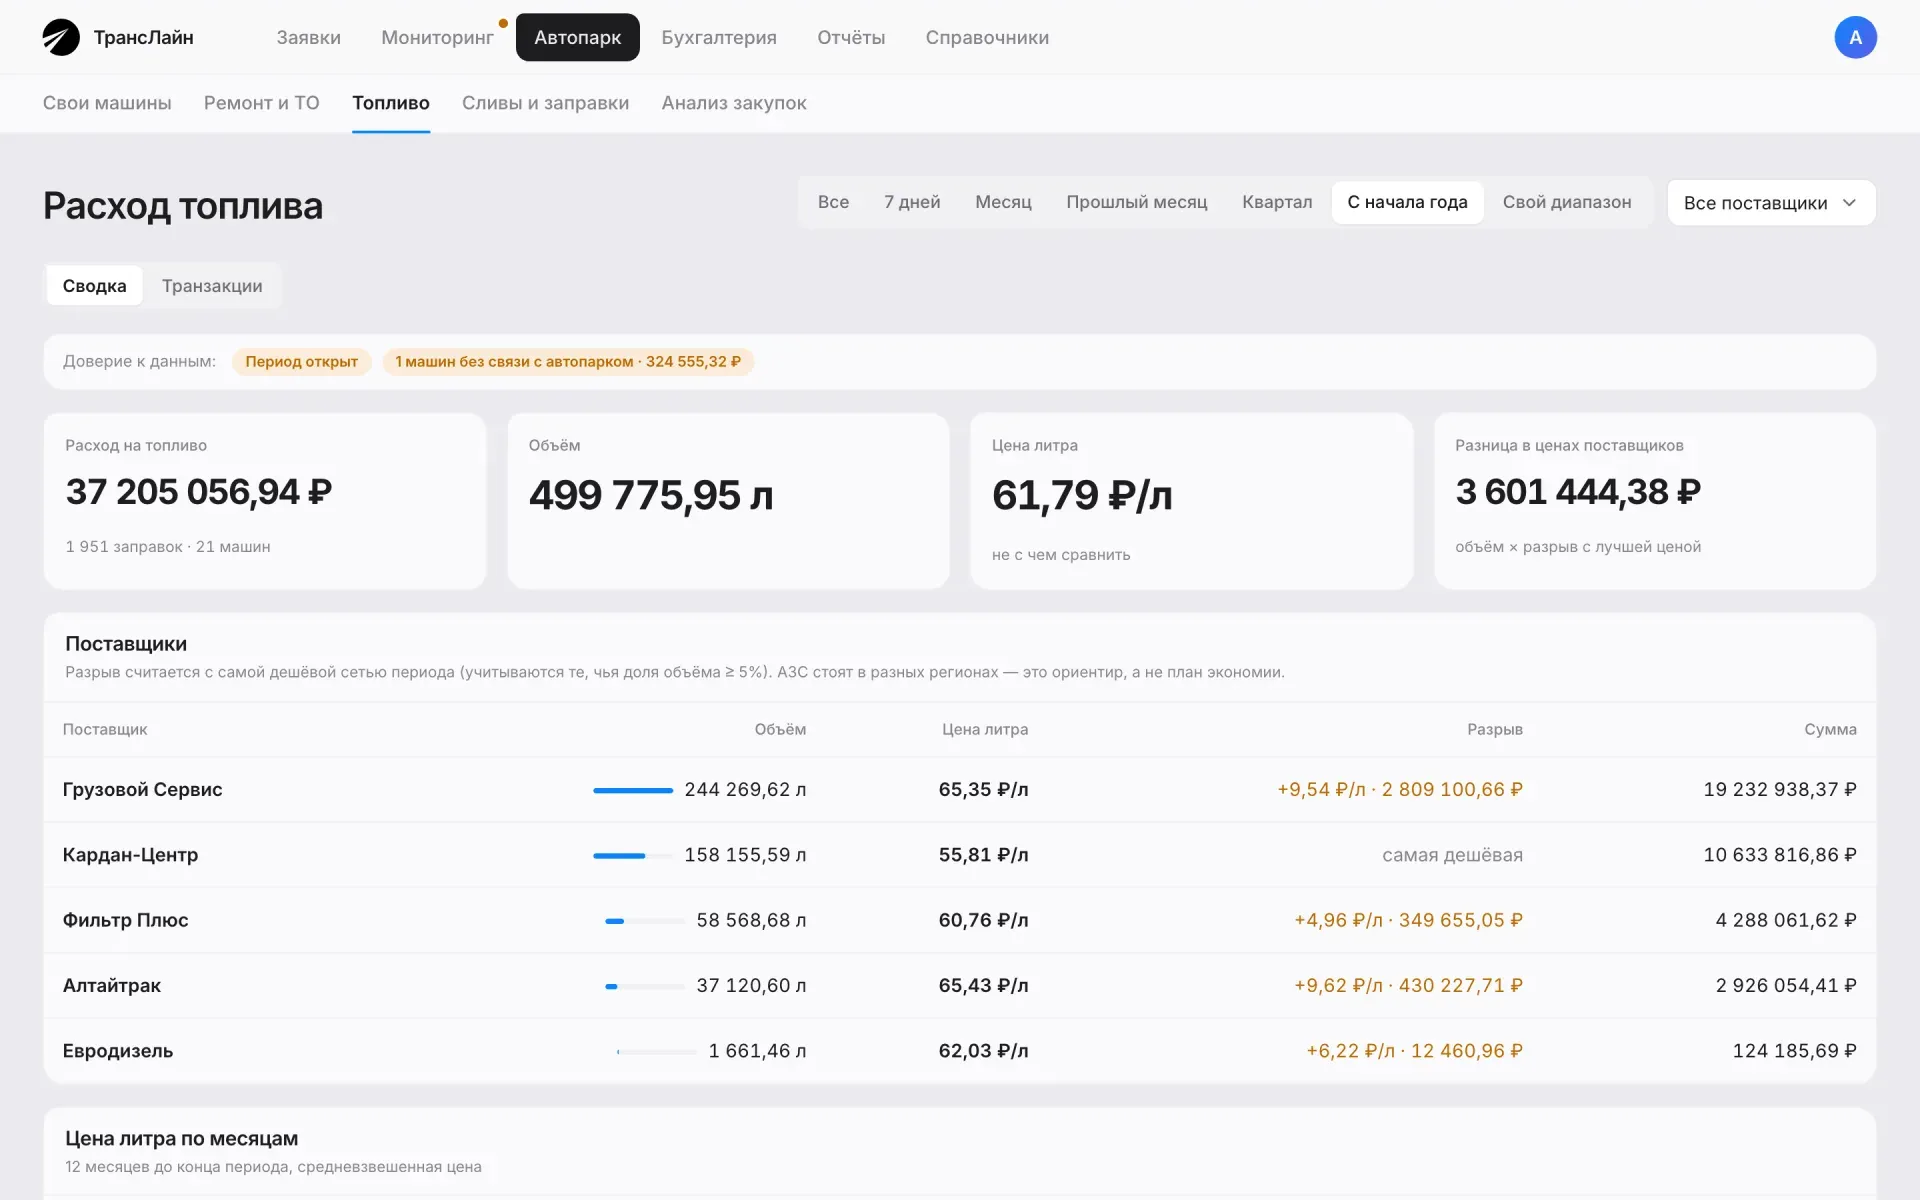
The July cross-check showed it. Fuel costs looked lower than they really were.
35%
We matched the chain’s reports against the fuel level sensors. On two trucks the numbers didn’t match — that’s how we found fuel being siphoned off.
03Repair invoices
The mechanic is sitting at the repair shop: the invoice has been sent, but they won’t release the truck until it’s paid. This wait used to stretch to 5 hours.
The invoice went from the mechanic to the manager, then to the finance specialist in Excel, then to the accountants — by email and in a chat. Everyone wrote the work categories their own way.
The mechanic sends the invoice through Max, the manager approves it or returns it with a comment, and the accountant processes it. From sending to payment takes 15–30 minutes, depending on how fast the manager replies.



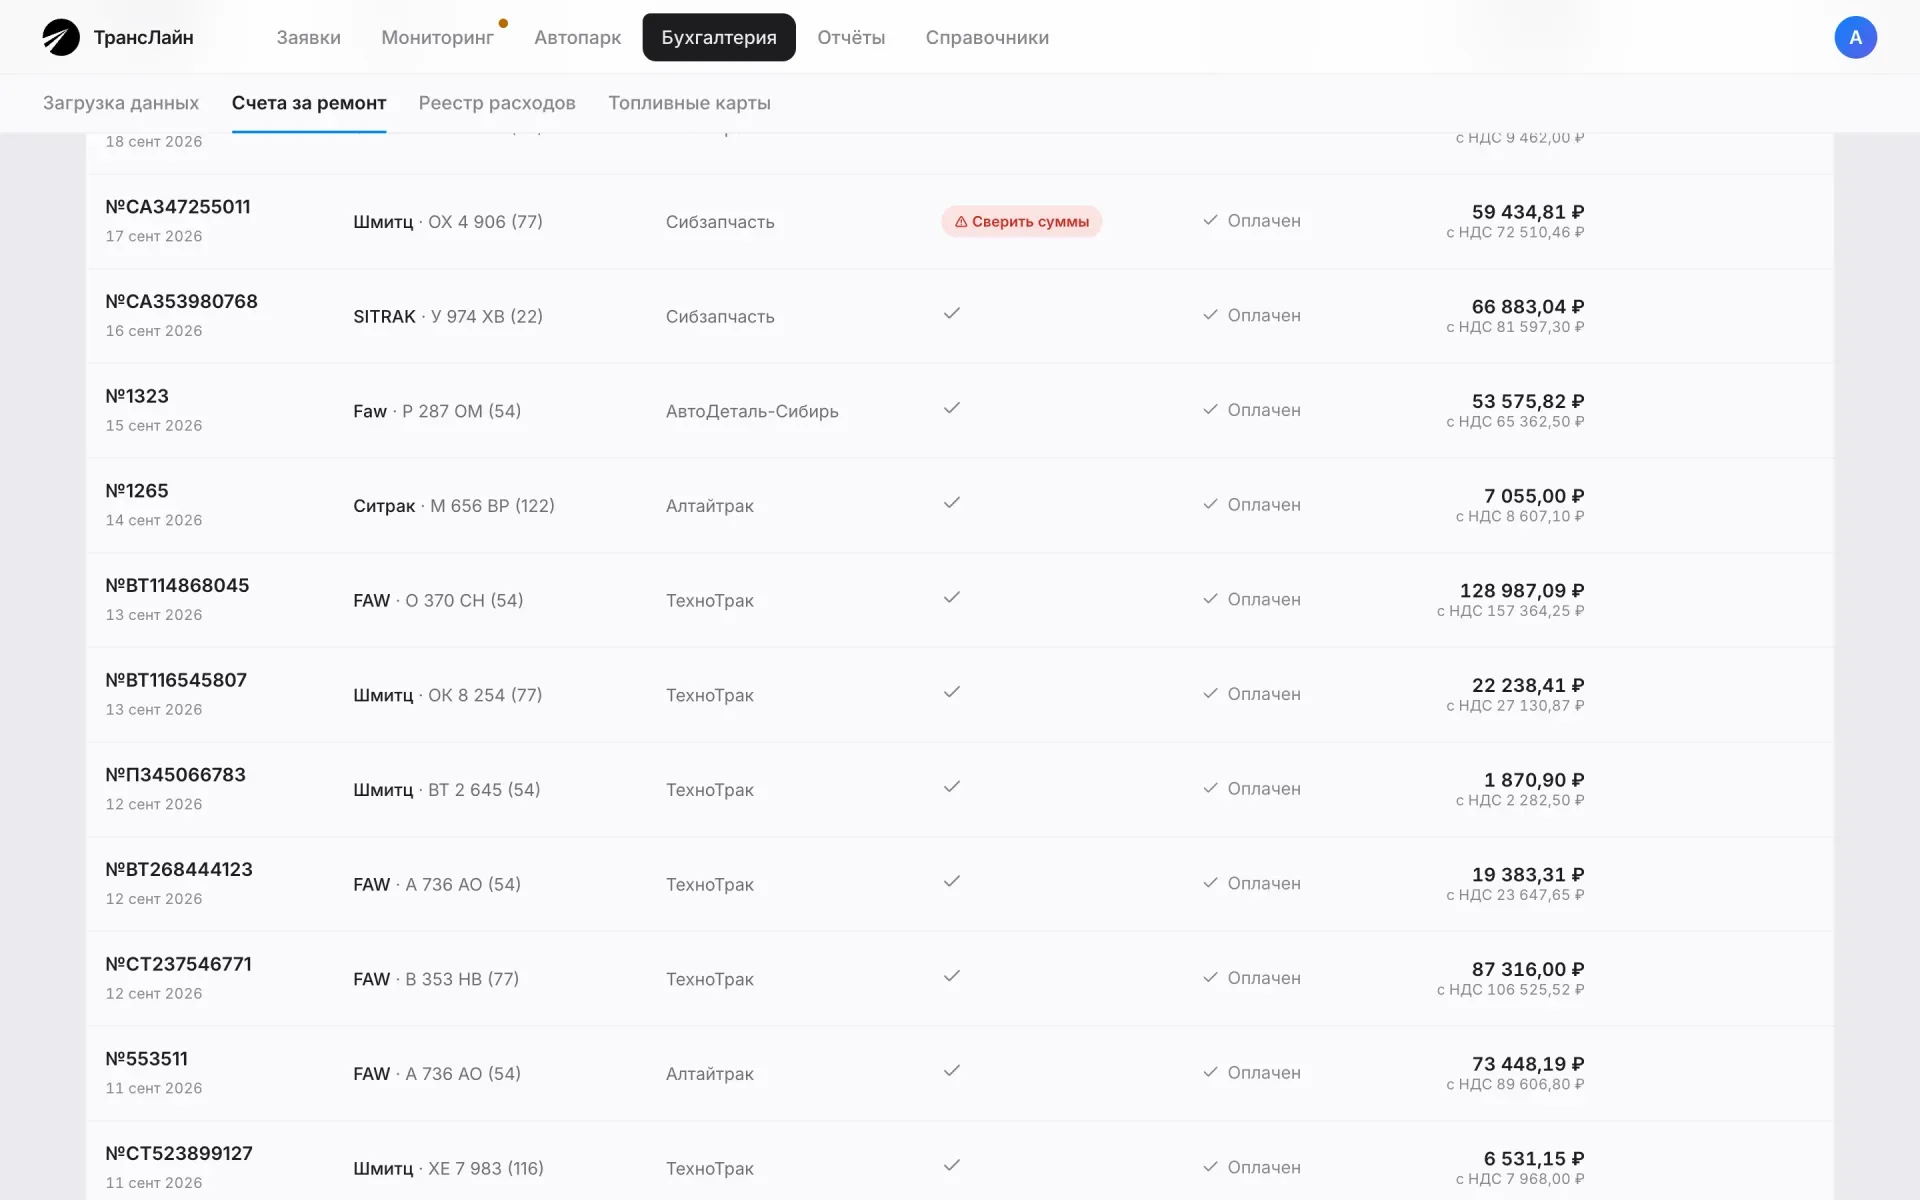
The mockup and description appeared on July 16. Since August 5, the mechanic and the manager have been working this way.
20 days
The line items show what each truck’s repairs cost and which breakdowns keep recurring. From that you can tell whether the driver takes care of the truck and whether the tractor itself was a good buy.
A supplier sends a 10-page PDF: an invoice, a work completion certificate, and a tax invoice. Recognition used to merge the documents — which produced duplicates and an inflated total. Now the AI finds the invoice pages itself, and if it finds nothing, it rereads the whole file.
The accountant enters the total, number, and date. The code checks the sum of the line items it read against that total. The scan is always alongside — a person can correct any reading.
Mechanic sends the PDF→Manager approves→Accountant processes→AI sorts the line items→Code checks the total→Analytics by truck
peopleAIcode
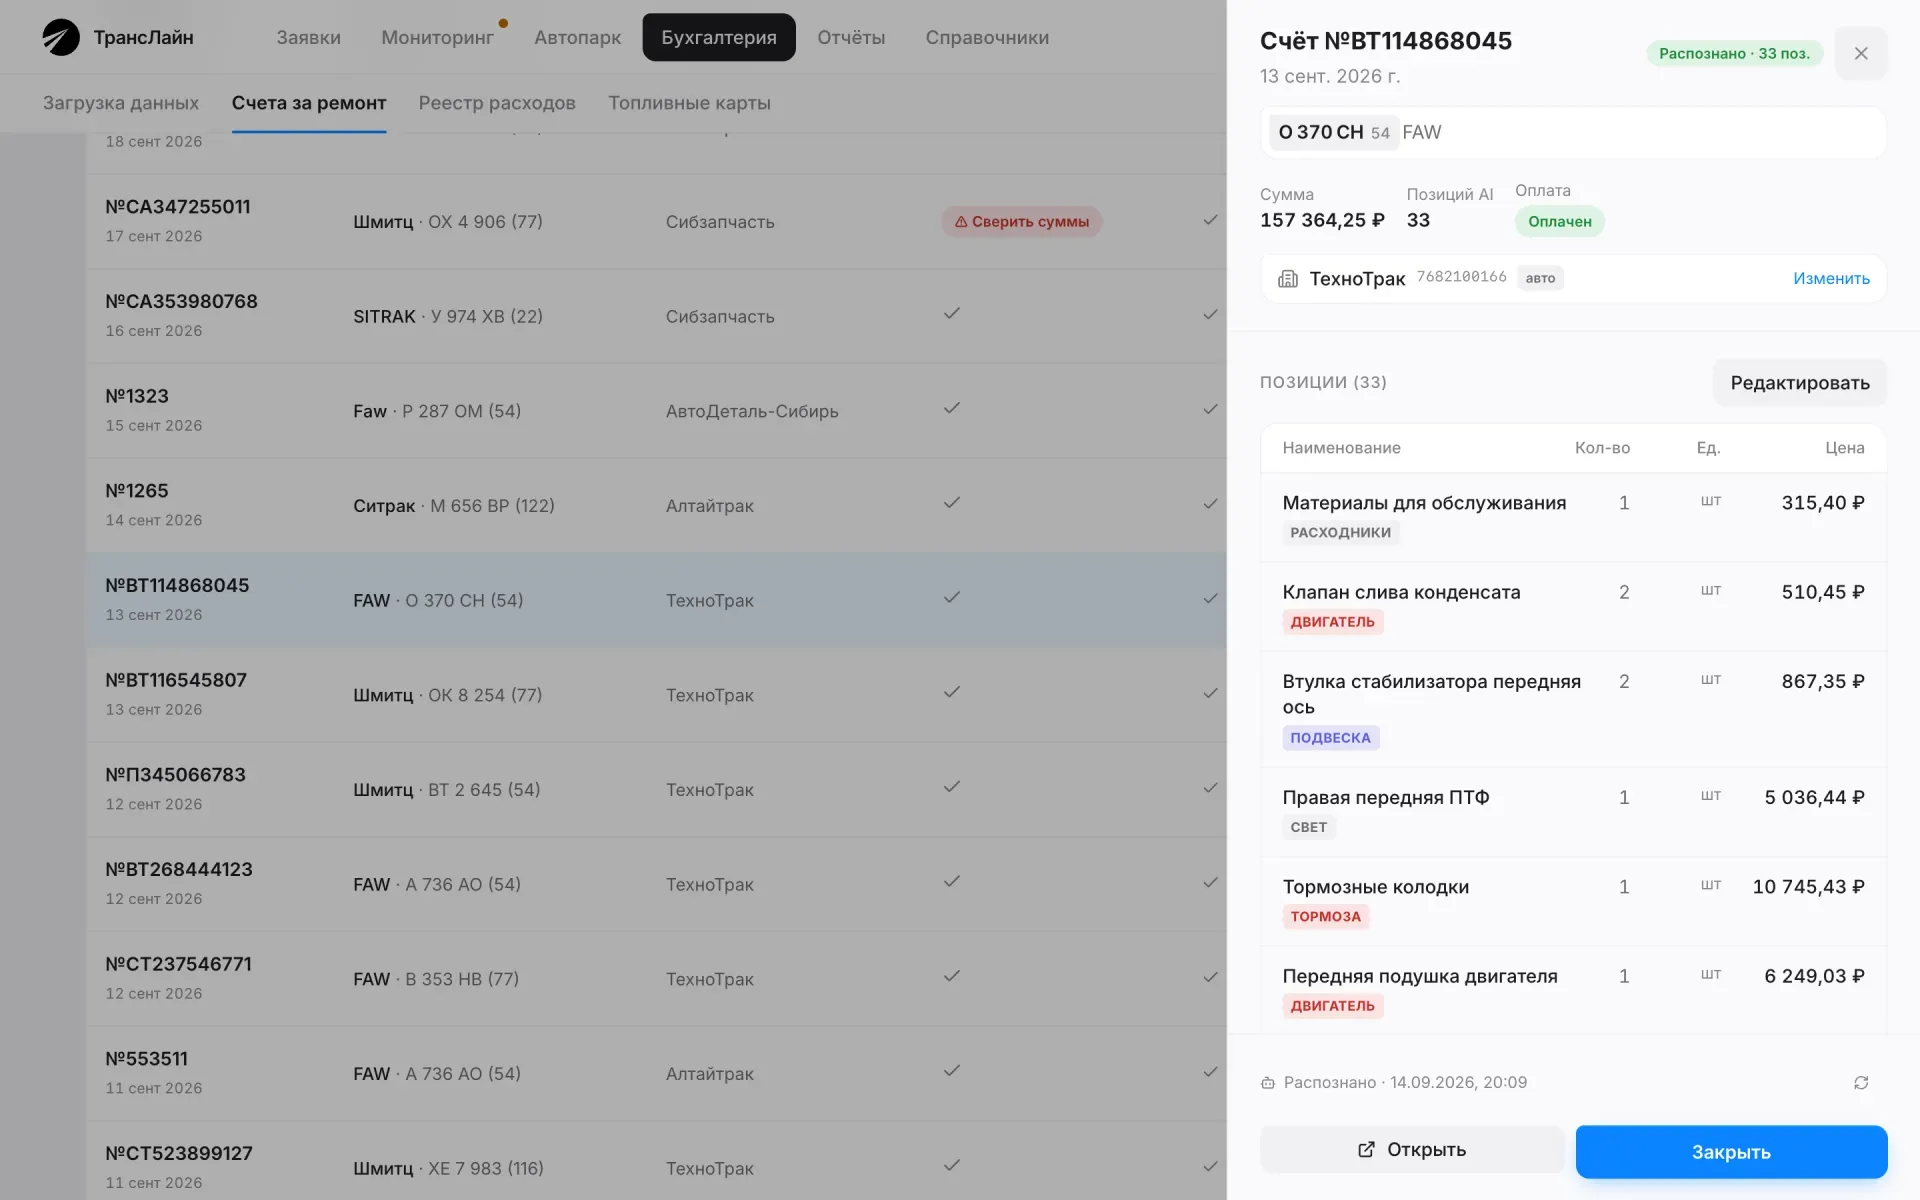
33 line items, each with a category: engine, suspension, brakes, labor
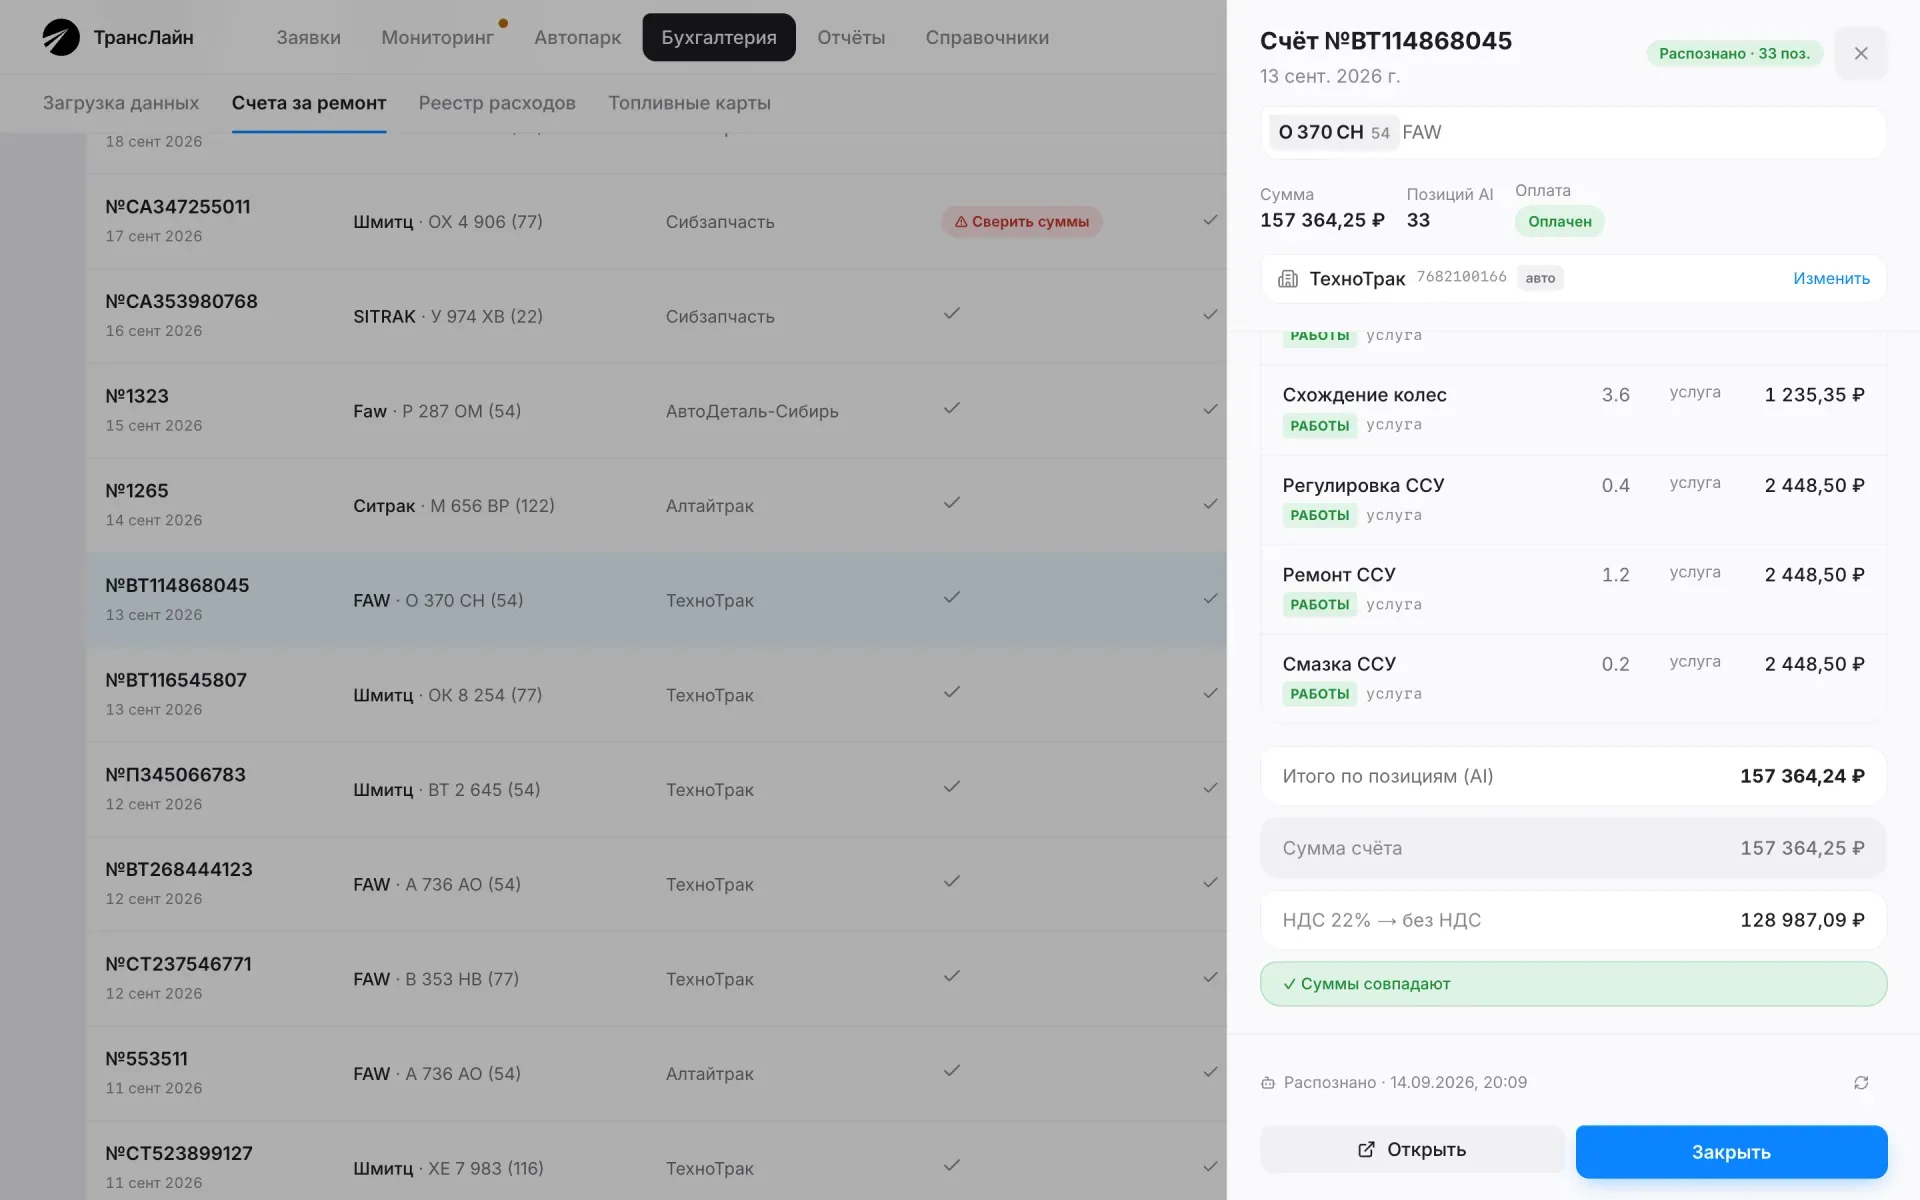
The totals match: the line items against the total the accountant entered
We give the AI only what a person can check. Code calculates, people decide.
04Expenses
The finance specialist used to spend most of the month on a spreadsheet built from emails and chats: find an invoice, copy the amount, check it. Now expenses are uploaded as files, and she checks the system’s calculations and comes up with ideas with us for what to add.
Leasing advances with no date didn’t make it into expenses: $69,000 across 8 contracts. Trucks looked more profitable than they were.
Road tolls, 1C entries, payroll sheets, and leasing schedules joined fuel and repairs. Advances are now spread across months.
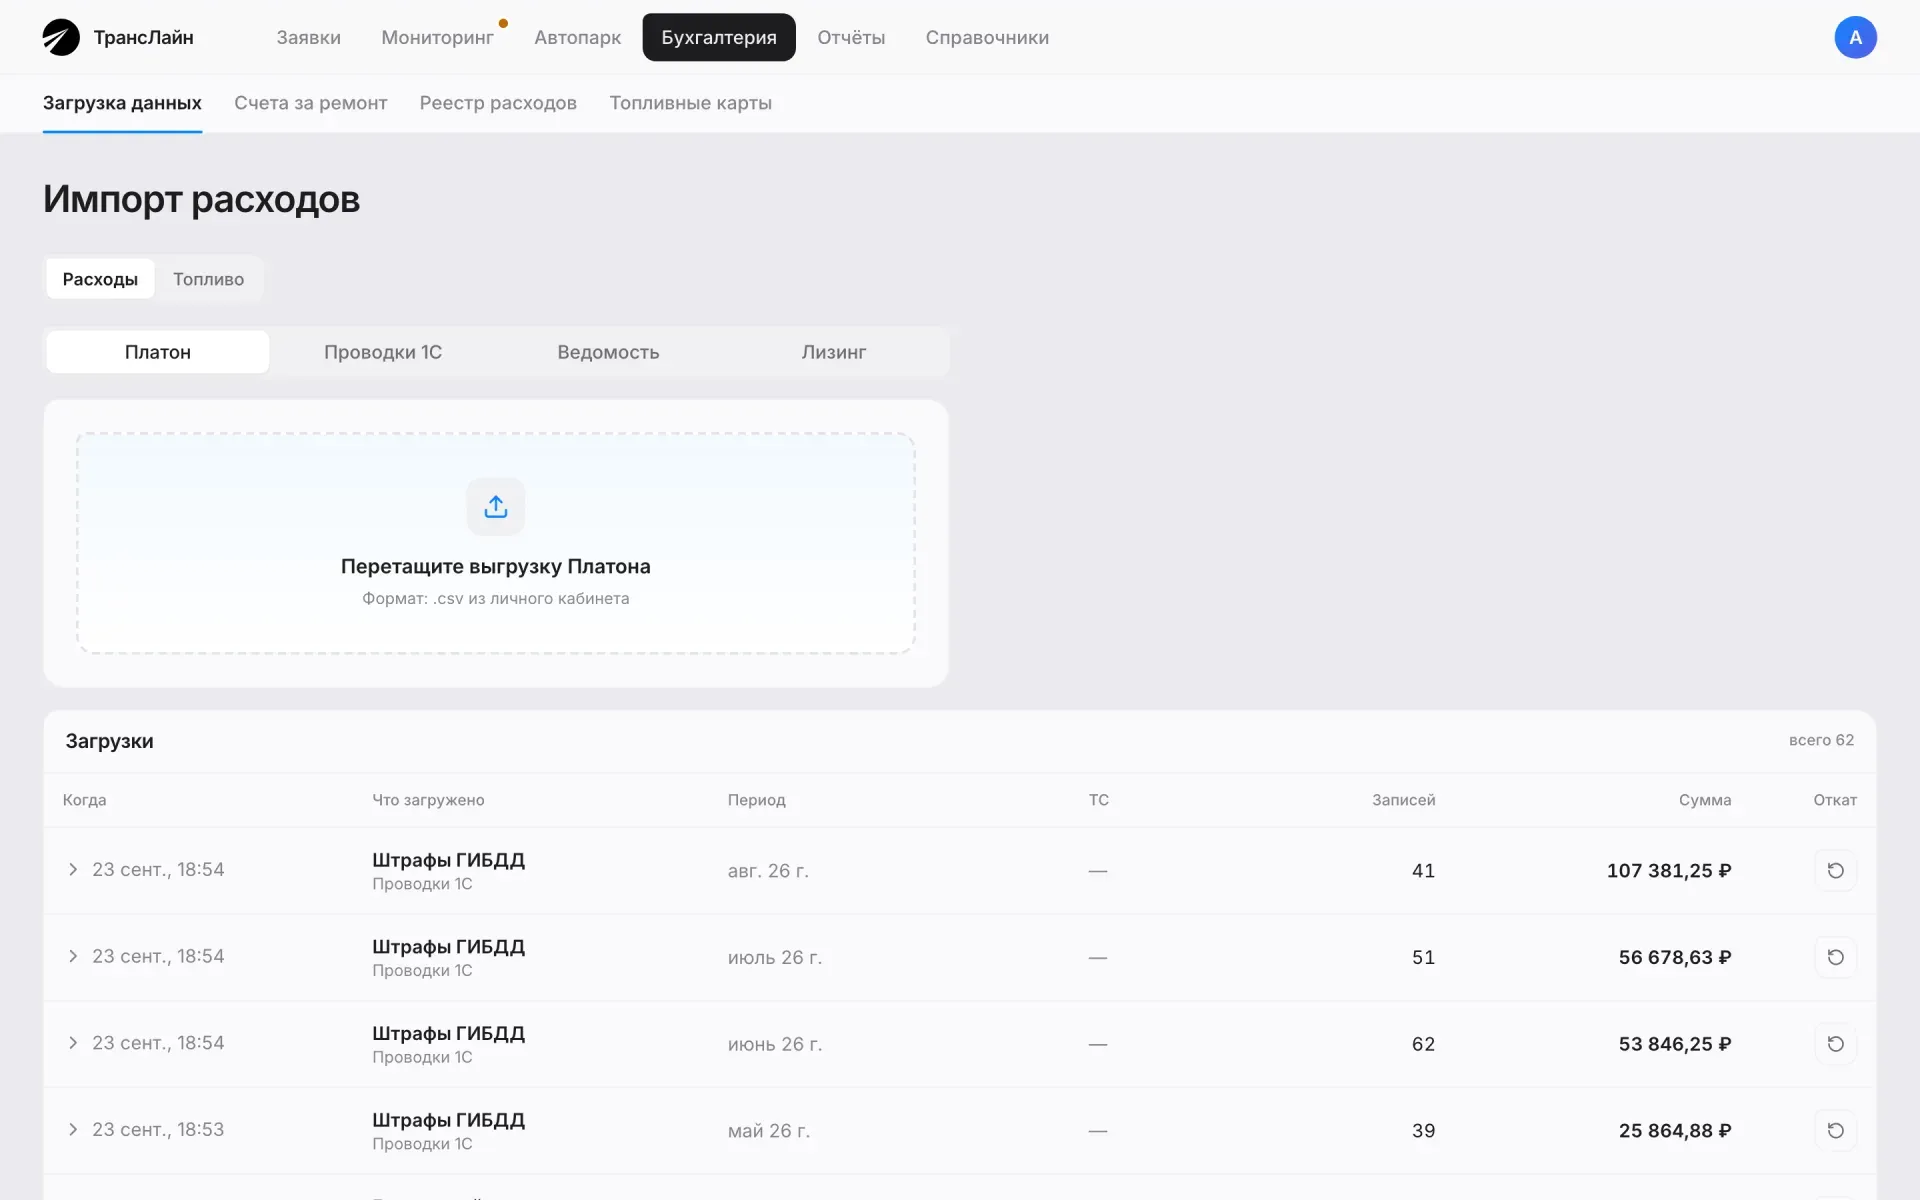
Trucks looked more profitable than they were. Now each advance is split across months and counted in every truck’s economics.
$69K
A traffic police fine from the 1C entries can be assigned to a person, a truck, or the whole fleet. The system matches last names from 1C with staff and drivers on its own.
05Fleet economics
The owner opens August. Without a data completeness check, he would have seen the best month of the year: an 85% margin and +$190,000. But fuel and salaries haven’t been entered yet.
Revenue with and without VAT was added together. Mileage was estimated, and loaded trips only. Incomplete expenses turned an ordinary month into a record one.
For every truck: revenue and expenses on one basis, excluding VAT, and mileage from the system’s own GPS track. If data is missing, the screen says so.
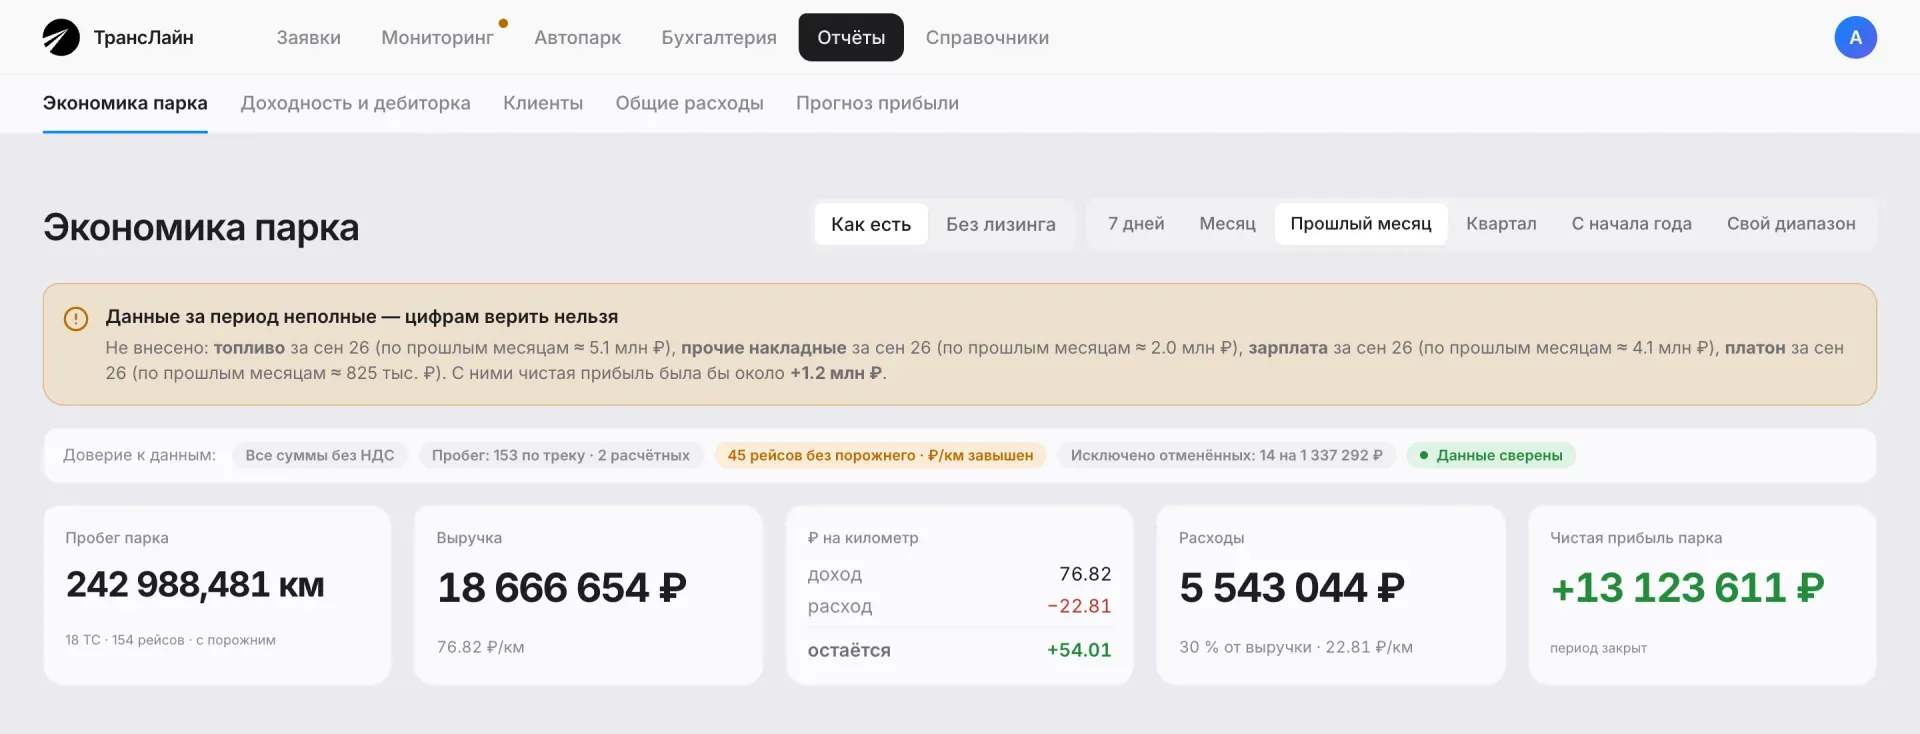
From May to July, amounts with and without VAT were added together. We put them on one basis.
17.3%
Repairs in Kazan turned out to be noticeably more expensive, so now the trucks are repaired in neighboring Bashkortostan. There are no decisions yet about the trucks themselves: the economics screen is new, and there are few full months of data.
06Clients
The CEO opens the clients screen and decides who to hand to the sales team to win back. In front of him are those who started shipping less often or disappeared altogether.
There was no permanent screen: the list was built with a one-off script, joining two databases by hand.
The system knows each client’s usual rhythm and shows who has started shipping less often. The sales team has a new metric — winning back clients who are going quiet.
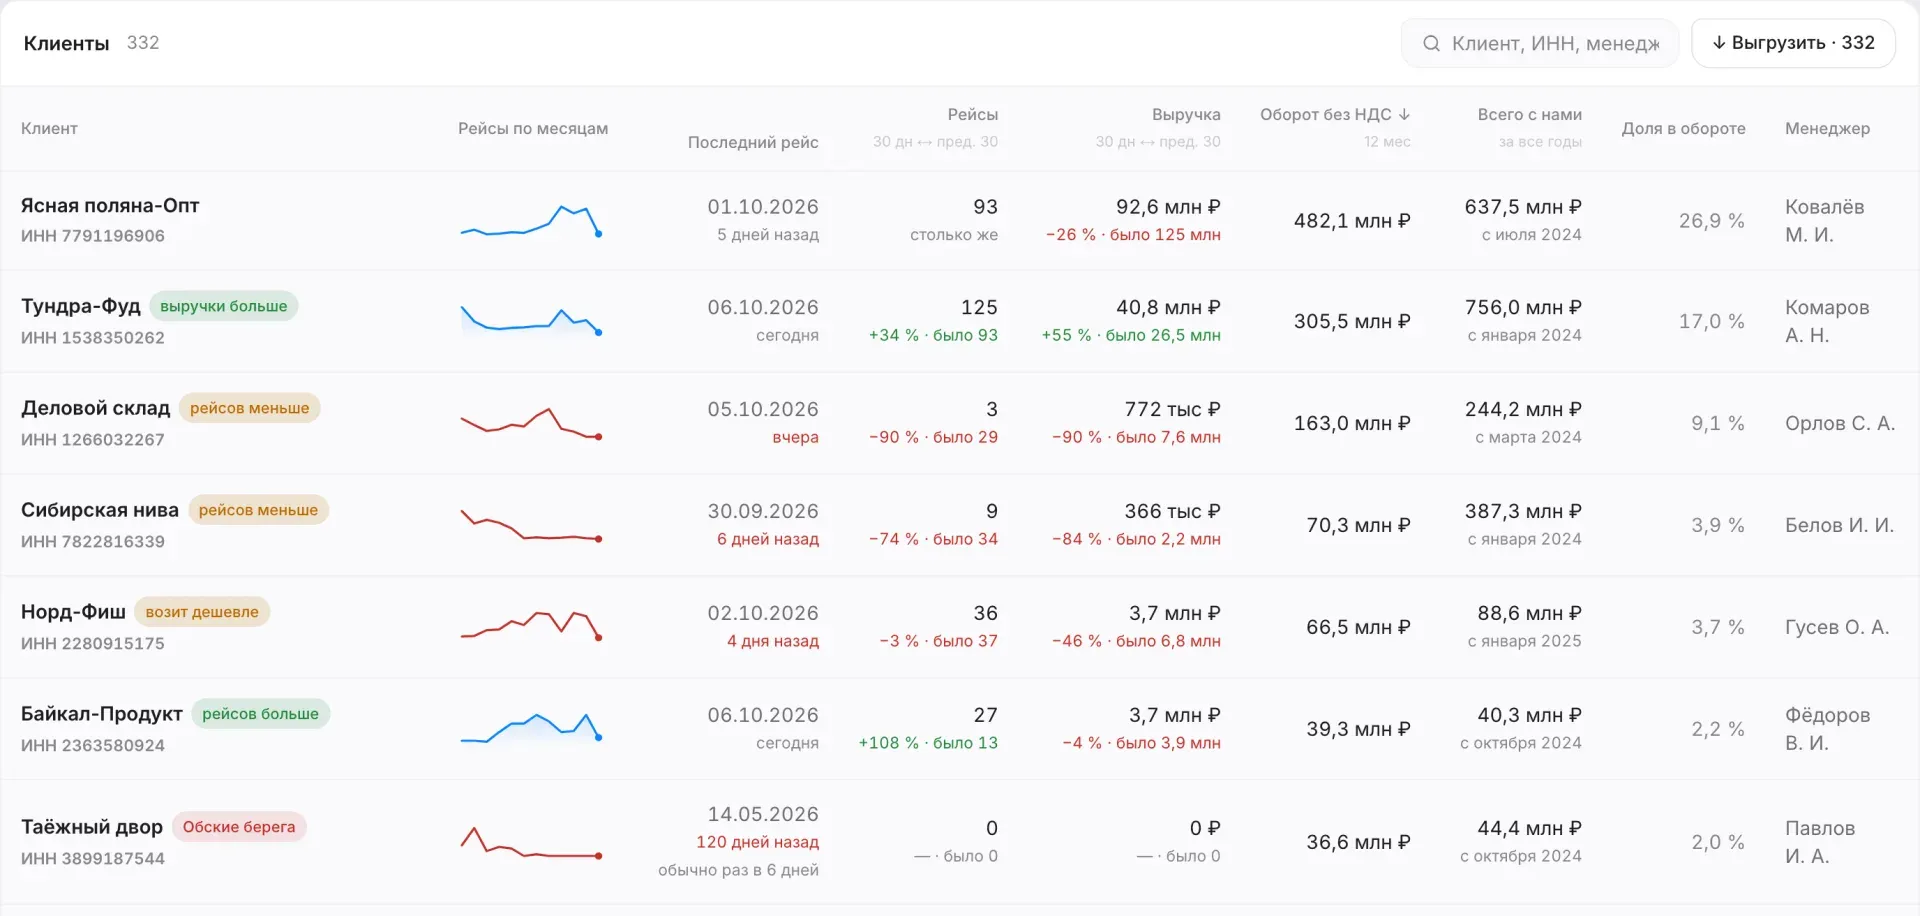
70 are shipping less, 64 have stopped, 38 are growing, and 21 are new. 114 of 295 clients use more than one logistics provider.
70 of 414
A simple average gave 156 false alarms on daily clients during development. A week without an order means one thing for a daily client and another for a client who ships once a month.
07Monitoring
Before dropping the paid service, the owner sets conditions: mileage known for 90% of trips, a gap of no more than 2%, and a month of parallel running. Then he waits for the cross-check.
Monitoring for 36 vehicles cost about $850 a month. To drop it, they had to prove that the company’s own track measures just as well.
The custom system now receives truck positions, mileage, fuel levels, and temperature in the cargo area. After the cross-check, the paid monitoring was switched off.
On the left is the owner’s bar, on the right is the cross-check result: 145 trips out of 147.
About $24 a month per vehicle, 36 vehicles.
$10K
We built the system for the company’s own fleet. The owner suggested the next step.
Really cool result, nobody else has anything like it. We’ll refine the system and sell it to colleagues
 DmitryOwner of TransLine
The finance specialist tests, checks the formulas, and suggests features. The owner, the manager, and the mechanic decide what should be on the screens.
The owner signs off on the mockup before any programming starts: what he’ll see and what action he’ll be able to take.
We test the calculations on a copy of the company’s data. That’s how we found missed expenses, other companies’ tractors in the orders, and amounts that didn’t match.
The finance specialist wrote about problems with the September fuel chain reports. Three fixes went out the same day.
carriers wrote on the first day that they’d buy the system “at any price”
Before there were any plans to sell it, Dmitry showed the system in an industry chat. On the very first day, five people wrote that they’d buy it “at any price.” Now we’re preparing a product for carriers.
Industry software is built by people from outside freight — they don’t know what a manager needs to calculate. Two kinds of expertise came together here:
Tell us what you put together by hand and which numbers you’re missing. No spec needed — a few sentences will do.
We’ll work out which problem to start with and estimate the scope, timeline, and cost.
This site uses cookies and Yandex Metrica to understand how it is used. Learn more